Google Analytics for Small Businesses: Stop Guessing
Google Analytics for Small Businesses: Stop Guessing, Start Knowing
A bakery owner asked me why her website wasn’t bringing in customers. She was posting on Instagram daily, running Facebook ads, and even started a blog.
“I’m doing everything right,” she said. “But I have no idea what’s actually working.”
I asked her one question: “What does your Google Analytics say?”
Blank stare.
She’d never looked at it. Didn’t even know it was installed on her site (her web developer had set it up two years ago).
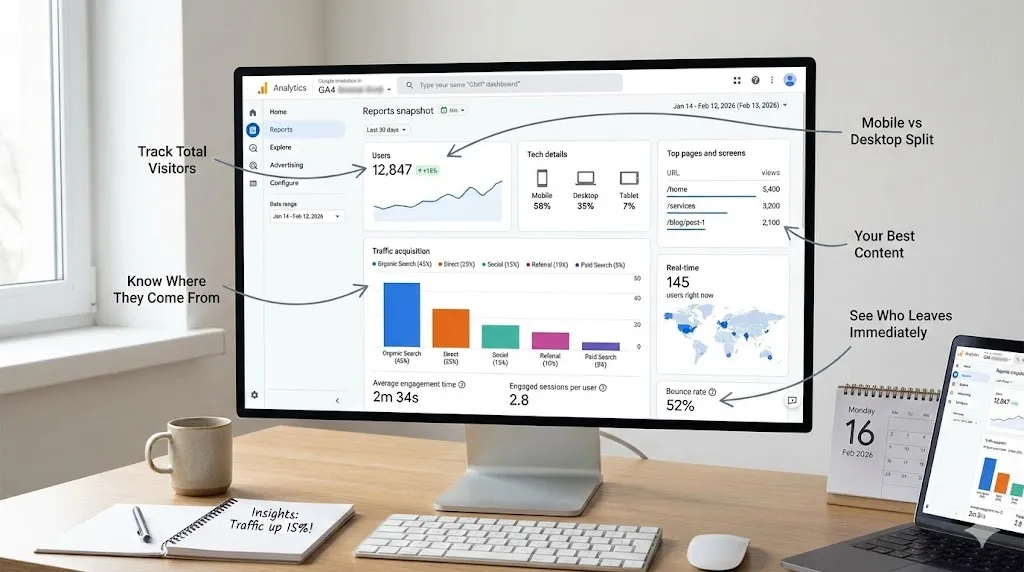
We spent 30 minutes looking at her data together. What we found:
- 73% of her traffic came from Google searches (not social media)
- Her most popular page was a blog post about sourdough bread (not her homepage)
- 68% of visitors were on mobile, but her online ordering only worked on desktop
- Her Facebook ads were driving traffic, but those visitors left within 10 seconds
She was spending $400/month on Facebook ads that weren’t converting, while her free Google traffic was actually bringing in customers.
One change — fixing mobile ordering — increased her online orders by 40% the next month.
That’s the power of actually looking at your data.
Why Most Small Businesses Ignore Analytics (And Why That’s Expensive)
Google Analytics is free. It tells you exactly what’s working and what’s not. Yet most small business owners never look at it.
Common excuses:
- “It’s too complicated” (it’s not — you only need 8 numbers)
- “I don’t have time” (it takes 10 minutes per week)
- “I’m not a data person” (you don’t need to be)
- “My web developer handles that” (they probably don’t check it either)
The cost of ignoring analytics:
You keep spending money on things that don’t work. You ignore the things that do work. You make decisions based on feelings instead of facts.
That’s like driving with your eyes closed and hoping you reach your destination.
The Only 8 Metrics You Need to Track
You don’t need to understand everything in Google Analytics. Just these 8 numbers.
Metric #1: Users (How Many People Visit)
What it tells you: Total number of unique people who visited your website.
Why it matters: This is your baseline. If you’re getting 100 visitors per month, you know the maximum number of potential customers your website can generate.
What to look for:
- Is the number going up, down, or flat?
- Any sudden spikes or drops? (A spike might mean a social post went viral. A drop might mean your site went down.)
Good benchmark: Depends on your business, but growth month-over-month is what matters.
Metric #2: Traffic Sources (Where They Come From)
What it tells you: How people find your website.
The main sources:
| Source | What It Means |
|---|---|
| Organic Search | Found you on Google (free) |
| Direct | Typed your URL directly |
| Social | Came from social media |
| Referral | Clicked a link from another website |
| Paid Search | Clicked on your Google ad |
| Clicked a link in your email |
Why it matters: Shows you where to invest your time and money.
If 60% of your traffic comes from Google and 5% from Instagram, maybe stop spending 3 hours a day on Instagram and invest in SEO instead.
What to look for:
- Which source brings the MOST visitors?
- Which source brings visitors who actually convert (buy, call, fill out form)?
- Are you over-investing in channels that don’t perform?
Metric #3: Bounce Rate (Who Leaves Immediately)
What it tells you: Percentage of visitors who land on your site and leave without doing anything.
Think of it like this: Someone walks into your store, looks around for 2 seconds, and walks out. That’s a bounce.
Benchmarks:
| Bounce Rate | Rating |
|---|---|
| 26-40% | Excellent |
| 41-55% | Average |
| 56-70% | Needs improvement |
| 70%+ | Something is wrong |
High bounce rate causes:
- Slow load time (people don’t wait)
- Confusing design (people don’t understand what you do)
- Wrong traffic (people expected something different)
- Mobile unfriendly (people can’t use your site on their phone)
- Misleading ads/titles (you promised something you didn’t deliver)
What to look for:
- Which pages have the highest bounce rate? Those need fixing first.
- Is bounce rate different on mobile vs desktop? If mobile is much higher, your mobile experience needs work.
Metric #4: Average Session Duration (How Long They Stay)
What it tells you: How long people spend on your website per visit.
Why it matters: Longer visits usually mean people are engaged with your content. Short visits mean they’re not finding what they need.
Benchmarks:
| Duration | Rating |
|---|---|
| 3+ minutes | Great engagement |
| 2-3 minutes | Average |
| 1-2 minutes | Below average |
| Under 1 minute | Problem |
How to improve:
- Better content (answer their questions)
- Internal linking (lead them to more pages)
- Videos (people watch videos longer than they read)
- Clear navigation (help them find what they need)
Metric #5: Pages Per Session (How Deep They Go)
What it tells you: How many pages people visit per session.
Why it matters: More pages = more engagement = more likely to convert.
Benchmarks:
| Pages/Session | Rating |
|---|---|
| 4+ pages | Excellent |
| 2-3 pages | Average |
| 1 page | They’re bouncing |
How to improve:
- Add “related posts” to blog articles
- Clear CTAs leading to next logical page
- Good internal navigation
- Compelling content that makes them want more
Metric #6: Device Breakdown (Phone vs Computer)
What it tells you: What devices people use to visit your site.
Why it matters: If 70% of your traffic is mobile but your site looks terrible on phones, you’re failing 70% of your visitors.
What to look for:
- What percentage is mobile vs desktop?
- Is the bounce rate higher on mobile? (If yes, your mobile experience needs work)
- Are mobile users converting at the same rate as desktop? (If not, something’s broken on mobile)
Action: Open your website on your phone right now. Is it easy to use? Can you find the phone number? Can you fill out the contact form? If not, fix it.
Metric #7: Top Pages (What People Actually Look At)
What it tells you: Which pages on your website get the most visits.
Why it matters: These are the pages people care about most. They should be your best pages.
What to look for:
- Is your homepage #1? (Usually yes, but not always)
- Are important pages (services, contact, pricing) in the top 10?
- Are blog posts driving traffic? (If yes, write more like those)
- Are any pages getting zero visits? (Maybe they’re hard to find)
Action: Make sure your top 5 pages have clear CTAs, are mobile-friendly, and load fast. These are your money pages.
Metric #8: Exit Pages (Where People Leave)
What it tells you: The last page people visit before leaving your site.
Why it matters: High exit rates on certain pages might indicate a problem.
Context matters:
- High exit rate on your “Thank You” page = GOOD (they completed the form)
- High exit rate on your pricing page = BAD (price scared them off or they couldn’t find what they needed)
- High exit rate on your homepage = BAD (they didn’t find what they were looking for)
What to look for:
- Which pages have abnormally high exit rates?
- Is there a pattern? (Are people consistently leaving at the same point?)
- What can you add to those pages to keep them engaged?
How to Set Up Google Analytics (If You Haven’t Already)
Step 1: Create a Google Analytics Account
- Go to analytics.google.com
- Sign in with your Google account
- Click “Start measuring”
- Enter your account name (your business name)
- Enter your property name (your website name)
- Select your business size and industry
- Click “Create”
Step 2: Add the Tracking Code to Your Website
Google will give you a tracking code (called a “tag”). You need to add it to every page of your website.
If you use WordPress:
- Install the “Site Kit by Google” plugin (free, official Google plugin)
- Connect it to your Google account
- It handles everything automatically
If you use Shopify:
- Go to Online Store > Preferences
- Paste your Google Analytics measurement ID (starts with “G-”)
- Save
If you use Squarespace/Wix:
- Look in Settings for “Analytics” or “Tracking”
- Paste your measurement ID
If you have a custom site:
- Add the tracking code to the
<head>section of every page - Or ask your developer to do it (takes 5 minutes)
Step 3: Set Up Goals (Conversions)
Goals tell Google Analytics when someone does something important on your site.
Common goals:
- Contact form submitted
- Phone number clicked
- “Add to cart” button clicked
- Newsletter signup completed
- Appointment booked
How to set up:
- In Google Analytics, go to Admin > Events
- Click “Create Event”
- Define the conditions (e.g., page URL contains “/thank-you”)
- Mark it as a conversion
This is the most important step. Without goals, you know HOW MANY people visit but not HOW MANY actually become customers.
Step 4: Wait for Data
Google Analytics needs at least 2-4 weeks of data before you can draw meaningful conclusions.
Don’t panic if numbers look low on day one. Let it collect data.
Your Weekly 10-Minute Analytics Routine
Every Monday morning, spend 10 minutes checking these numbers.
The Monday Morning Check:
- Users this week vs last week — Going up or down?
- Top traffic sources — Where are people coming from?
- Bounce rate — Are people staying or leaving?
- Top pages — What are people looking at?
- Conversions — How many leads/sales this week?
- Mobile vs desktop — Any device-specific issues?
Write down the numbers. Keep a simple spreadsheet or even a notebook. After a month, you’ll start seeing patterns.
What to do with the data:
- Traffic up from Google → Your SEO is working, keep doing what you’re doing
- Traffic down from social → Your social strategy needs adjustment
- Bounce rate high on one page → That page needs improvement
- Mobile conversion rate low → Fix your mobile experience
- One blog post getting tons of traffic → Write more content like that
Common Google Analytics Mistakes
Mistake #1: Not Having Goals Set Up
Without goals, Google Analytics tells you how many people visited, but not how many became customers. That’s like a store counting foot traffic but never counting sales.
Fix: Set up at least one goal (contact form submission, phone call, purchase) today.
Mistake #2: Checking Daily Instead of Weekly
Daily numbers fluctuate wildly. Monday might have 50 visitors, Tuesday might have 200. That’s normal.
Fix: Check weekly. Compare this week to last week, this month to last month. Look for trends, not daily spikes.
Mistake #3: Looking at Only Total Traffic
Total traffic is a vanity metric. 10,000 visitors who don’t buy anything is worse than 100 visitors who all become customers.
Fix: Focus on conversion rate, not just visitor count.
Mistake #4: Ignoring Mobile Data
Your mobile and desktop experiences might be completely different. If you only look at combined data, you miss problems.
Fix: Always segment by device. Check if mobile bounce rate is significantly higher than desktop.
Mistake #5: Not Filtering Out Your Own Visits
If you visit your own site 10 times a day, you’re inflating your numbers.
Fix: Set up an IP filter in Google Analytics to exclude your own visits. Go to Admin > Data Streams > Configure tag settings > Define internal traffic.
Mistake #6: Making Big Decisions on Small Data
100 visitors isn’t enough to draw conclusions. You need at least 1,000 visitors or 4 weeks of data before making changes.
Fix: Be patient. Collect enough data before reacting.
Red Flags to Watch For
If you see any of these, take action immediately:
| Red Flag | Possible Cause | Action |
|---|---|---|
| Sudden traffic drop (50%+) | Site down, Google penalty, tracking broken | Check site status, Search Console |
| Bounce rate over 80% | Slow site, wrong traffic, bad UX | Speed test, review landing pages |
| Mobile bounce 2x desktop | Mobile site broken | Test on multiple phones |
| Zero conversions for 2+ weeks | Form broken, goal misconfigured | Test forms, check goal setup |
| One source drops to zero | Social account issue, ad paused | Check the source directly |
| Average session under 30 seconds | Content doesn’t match expectations | Review top landing pages |
The Analytics Checklist
Setup
- ☐ Google Analytics account created
- ☐ Tracking code installed on all pages
- ☐ Goals/conversions configured
- ☐ Internal traffic filtered out
- ☐ Google Search Console connected
Weekly Routine
- ☐ Check users (up, down, flat?)
- ☐ Review traffic sources
- ☐ Check bounce rate by page
- ☐ Review top pages
- ☐ Check conversion count
- ☐ Note any anomalies
Monthly Review
- ☐ Compare this month to last month
- ☐ Identify best-performing content
- ☐ Check mobile vs desktop performance
- ☐ Review goal completion rates
- ☐ Adjust strategy based on data
The Bottom Line
Google Analytics tells you what’s working and what’s not. For free.
You don’t need to be a data scientist. You need to spend 10 minutes a week looking at 8 numbers.
Start here:
- Make sure Google Analytics is installed on your site
- Set up at least one goal (form submission, phone call, purchase)
- Check your numbers every Monday morning
- Make decisions based on data, not feelings
- Focus on trends, not daily fluctuations
The businesses that win aren’t always the ones with the biggest budgets. They’re the ones that know their numbers and act on them.
Need help setting up Google Analytics or understanding your data? We help small businesses make sense of their website performance. Visit gusdigitalsolutions.com for a free consultation.
Stop guessing. Start knowing.

Written by Gustavo Vasquez
Web developer and digital marketing consultant helping small businesses get online. 15+ years of tech experience, bilingual (English/Spanish).
Book a free consultationRelated Articles

Email Marketing Returns $42 for Every $1 Spent
Learn how email marketing delivers the highest ROI in digital marketing. Build your list, write emails people read, and avoid common mistakes.
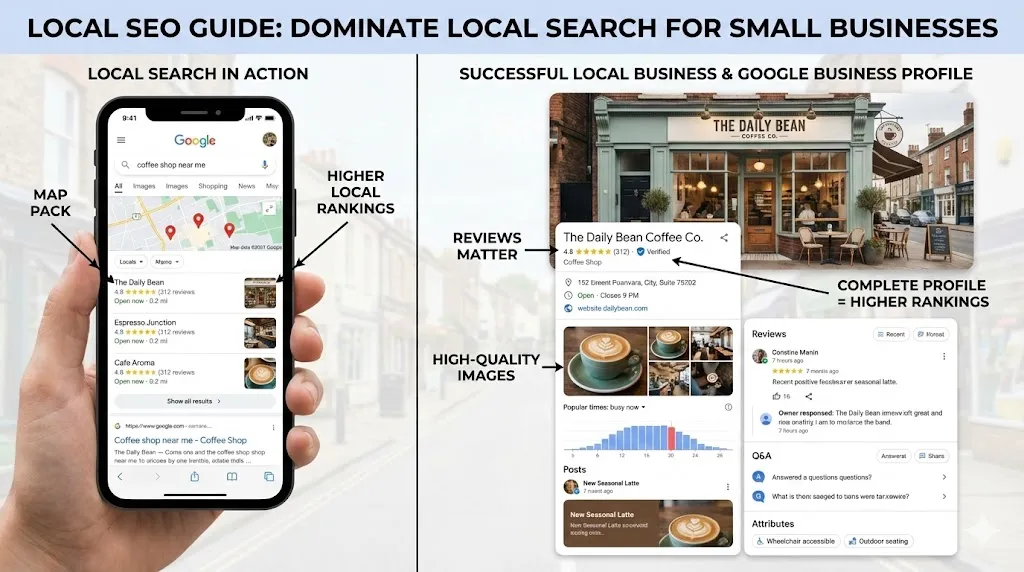
How Local SEO Can 10X Your Small Business
Learn how local SEO helps small businesses dominate Google Maps and local search. Complete guide with Google Business Profile tips, review strategy, and actionable checklist.
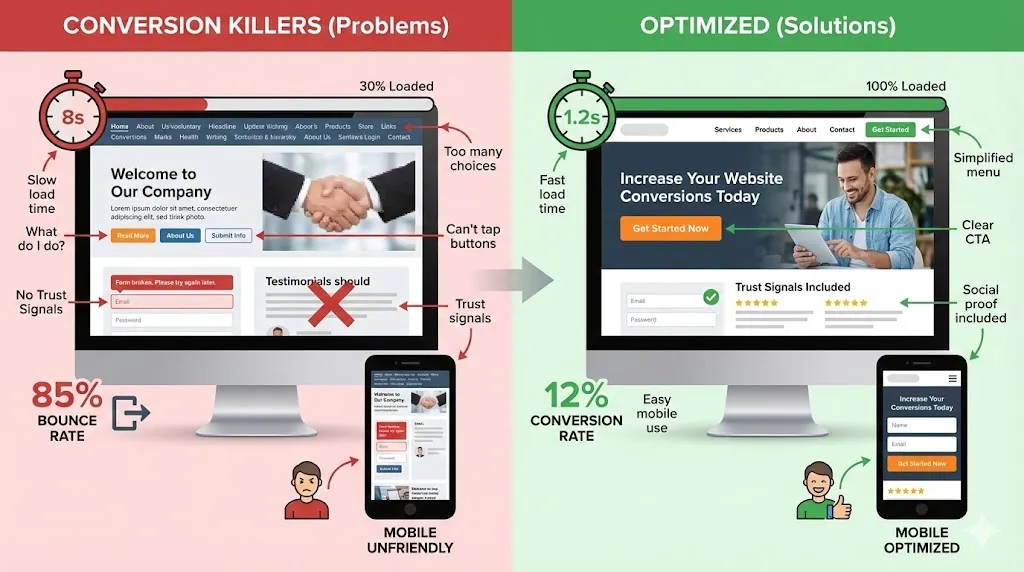
Why Your Website Gets Traffic But Zero Sales
Your website gets visitors but no sales? Fix the 3 conversion killers destroying your business. Homepage anatomy, mobile tips, and full checklist.
Need help with your project?
Whether it's SEO, a new website, or fixing bugs - I can help.
Get in Touch